SAT Scores Tell Us Zip!
Comparisons of SAT scores within a given year are pretty-much meaningless. Comparisons of percentiles are much more meaningful.
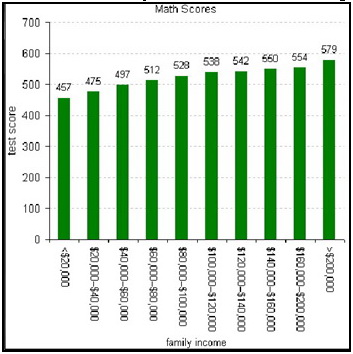
Consider the 2009 SAT Math scores presented in an Economix blog:
 The higher the family income, the higher the average score math score. But how big is this difference. Yes, 122 points between the extremes. But so what? What does 122 points mean?
If one knows the possible range of scores (200 to 800), one can make some comparison. But this isn’t very helpful.
Another technique is to make a percentage comparison. Here the top score (579) is 27% more the bottom score (457). But this comparison is meaningless. SAT scores are arbitrary. They are selected to range from 200 to 800 – a factor of four or a difference of 300%. If we added 1,000 to each score, they would range from 1200 to 1800 – a factor of 1.5 or a difference of 50%. By focusing on arbitrary scores, this graph promotes statistical illiteracy.
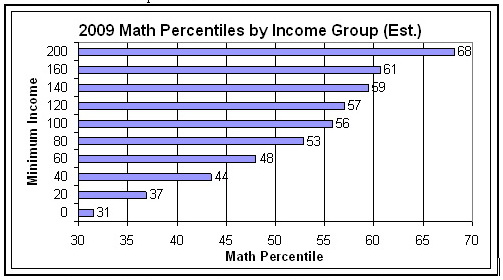
We need a better way to put scores in context. Consider this: These values are percentiles. Percentiles are not arbitrary; they provide their own context. In this case, scores range from the 31-st percentile to the 68-th percentile. The high-low income SAT Math gap is 37 percentiles.
Anyone reading this graph can immediately see how much the SAT Math scores are influenced by family income — or by income related factors.
Why didn’t the blogger present the scores in this fashion. The College Board provides data by family incomes as SAT scores – not by percentiles. Also, the College Board doesn’t provide a convenient way to convert SAT scores to percentiles.
Recommendation: The College Board should give their results as SAT scores AND as percentiles – or give a way to convert SAT scores into percentiles.
Sources:
Blog: http://economix.blogs.nytimes.com/2009/08/27/sat-scores-and-family-income/
Data: http://professionals.collegeboard.com/profdownload/SAT-Percentile-Ranks-2009.pdf